ByteDance Excel Masterclass: Why Efficiency Is the Ultimate Interview Metric
At ByteDance, the Excel interview is not about whether you can use a Pivot Table. It is about whether you build systems that eliminate work — or whether you just complete tasks faster.
Day 1 of the ByteDance DA series covered SQL — the extraction layer. Day 2 covered statistics — the validation layer. Day 3 moves to Excel, and the framing shift is immediate: this is not a test of formula knowledge. It is a test of whether you think at the task level or the systems level.
In a high-intensity environment like ByteDance, time is the scarcest resource. The Excel portion of the DA interview is designed to surface candidates who have internalised the automation mindset — who reach for batch processing, Power Query, and dynamic references not because they were told to, but because they instinctively reframe every repetitive task as a system to be built once and eliminated forever.
A candidate who knows how to create a folder manually has passed a task. A candidate who answers the same question by concatenating Excel formulas into a .bat file that creates 500 folders in 10 seconds has demonstrated the systems thinking that ByteDance explicitly values in senior DA profiles. The technical skill is a proxy for the mindset. That is what Day 3 is testing.
The Three Mastery Levels — Where ByteDance Sets the Bar
The ByteDance Excel interview is structured around three implicit proficiency tiers. Most candidates arrive at Level 1 or Level 2. The interview is designed to find candidates who operate at Level 3 — not because Level 3 requires the most difficult formulas, but because it requires a fundamentally different orientation toward the tool.
The distinction that the interview is designed to surface: Level 1 and Level 2 candidates solve problems. Level 3 candidates eliminate categories of problems. When asked how they would generate 1,000 personalised sales statements, a Level 2 candidate describes an efficient manual process. A Level 3 candidate describes Mail Merge or a Python script — a single build that makes the question permanently irrelevant. ByteDance is hiring Level 3 thinkers and using Excel questions to find them.
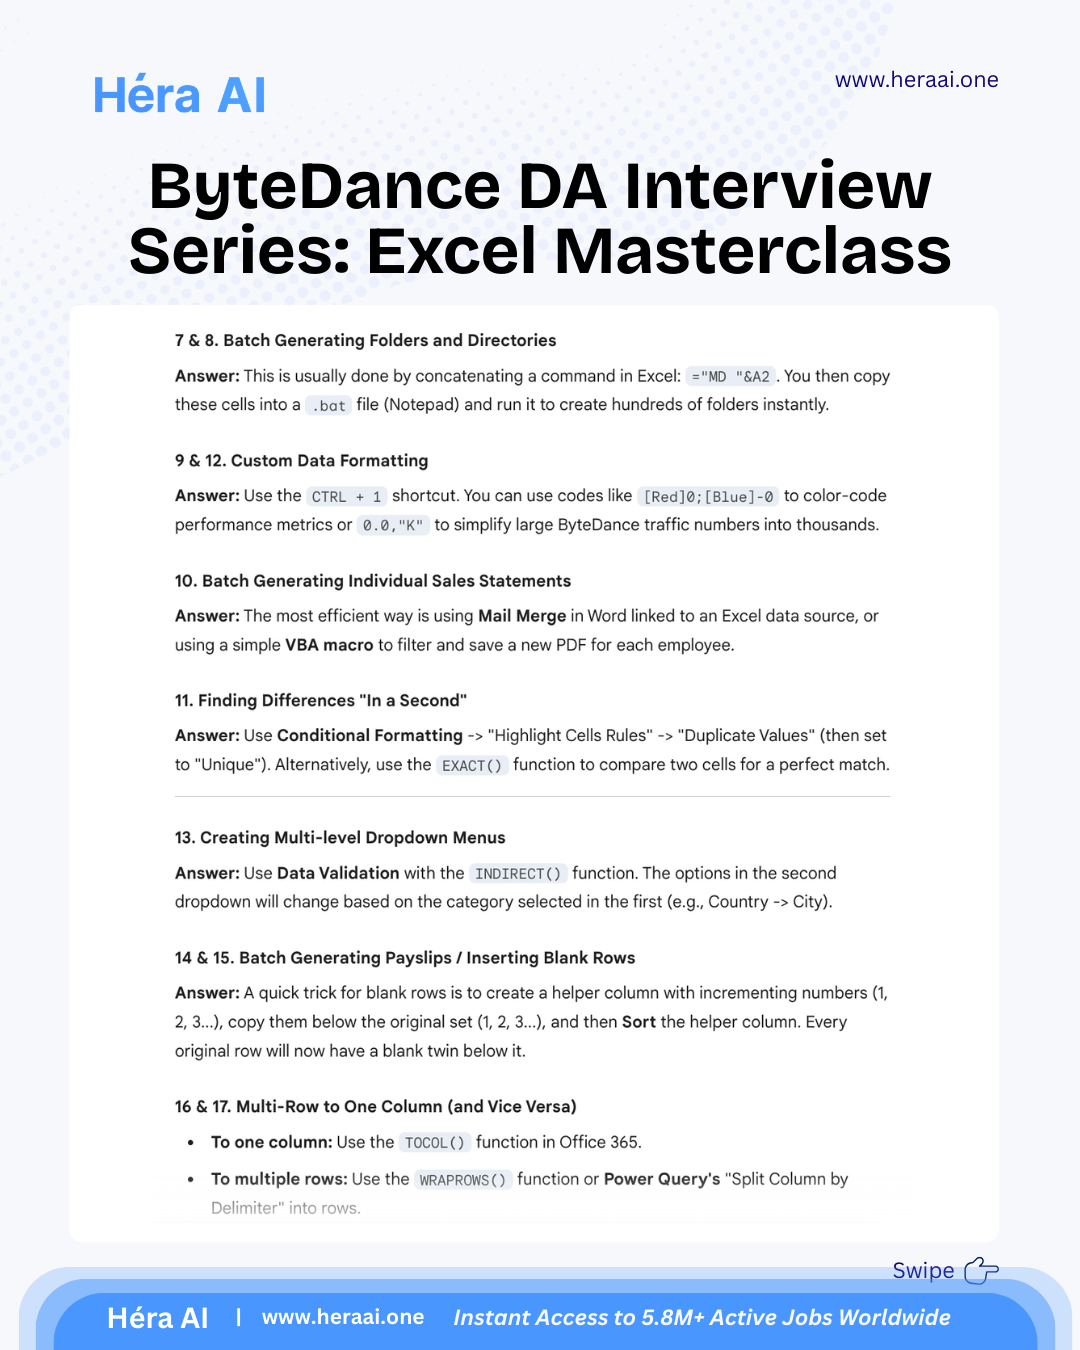
Power Query: The Replacement for VLOOKUP at Scale
The single clearest signal of a Level 2-to-3 transition in Excel competency is the shift from VLOOKUP to Power Query. VLOOKUP is fragile — it breaks when columns are inserted, fails on approximate matches in large datasets, and requires manual re-execution when source data changes. Power Query is a transformation engine that maintains a reproducible, refreshable pipeline from source data to output table.
ByteDance interviewers test Power Query not because it is technically impressive, but because it represents a data pipeline mindset — the understanding that data transformation is a repeatable process to be architected, not a one-time manipulation to be performed. The four operations below are the ones most frequently appearing in the Day 3 interview.
The unpivot signal and why it matters beyond Excel: When a ByteDance interviewer asks you to analyse a wide-format table with dates as column headers, the correct response is Power Query Unpivot — not a manual transpose, not a series of VLOOKUP references to each column individually. The unpivot answer demonstrates two things: that you know the long-format data structure that downstream tools require, and that you reach for a transformation engine rather than a formula workaround. It signals that you think about data in terms of pipelines and schemas, which is exactly the mental model ByteDance DAs need when working between raw data exports and BI layers.
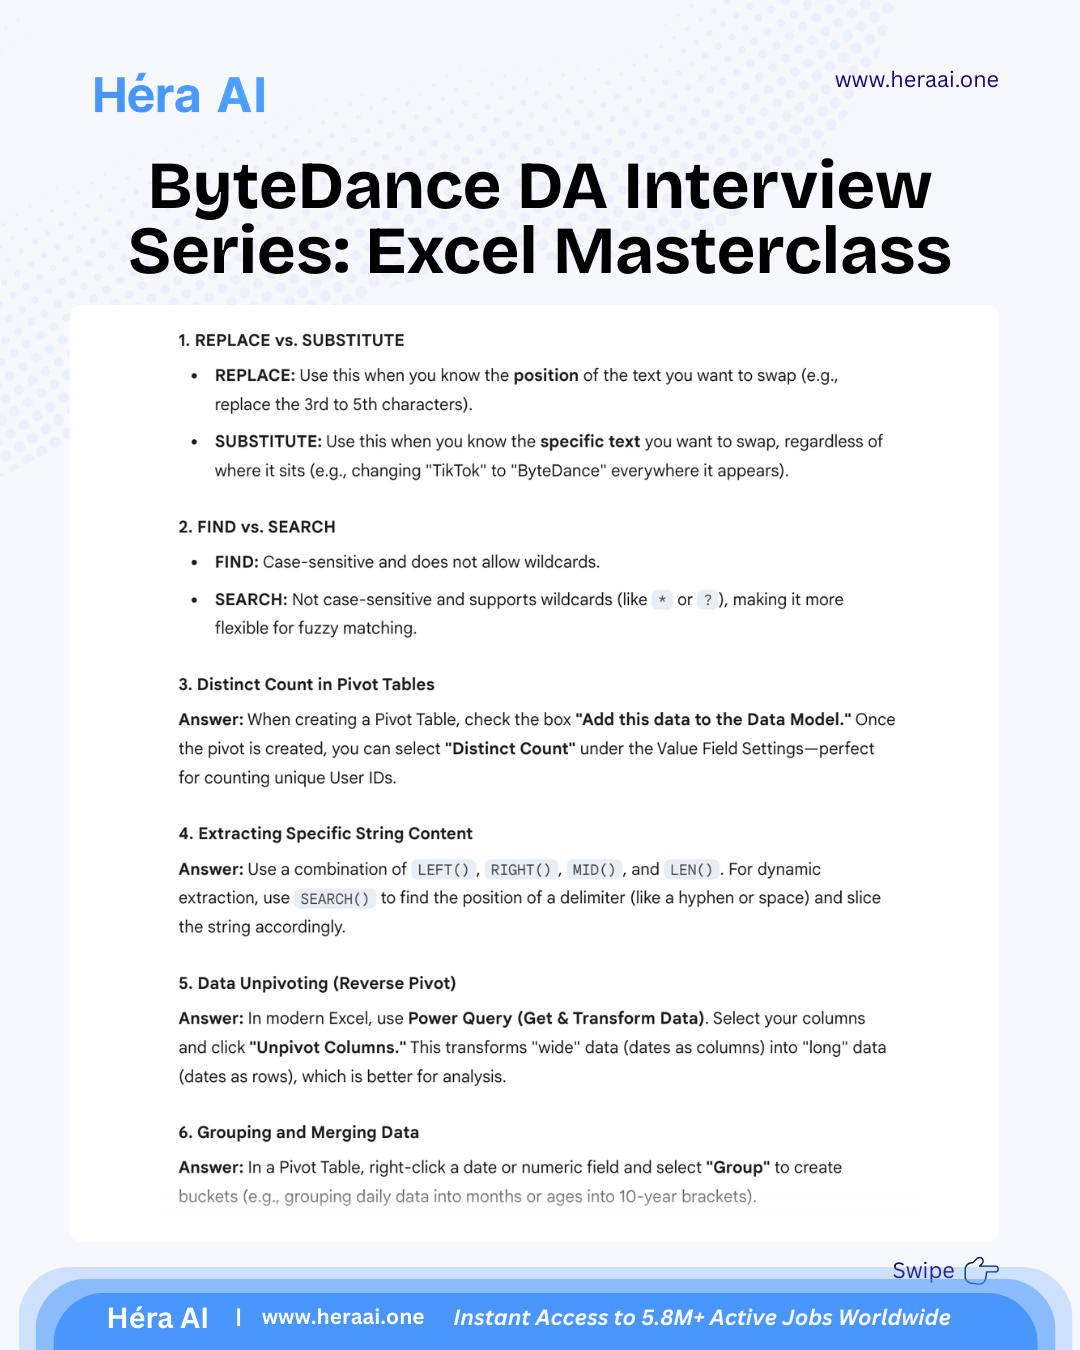
String Manipulation: Cleaning TikTok Data at Row Scale
User-generated data from a platform like TikTok arrives messy: hashtags with inconsistent capitalisation, content IDs structured as delimited strings, device identifiers embedded in URL parameters. The string manipulation techniques below are tested because they represent the real data cleaning work that ByteDance DAs perform — not because the formulas are inherently advanced.
The key distinction the interview is probing: do you know which tool to use for which data condition, and can you compose functions dynamically rather than applying fixed-length extractions that break when the data structure changes?
The formula composition principle that separates Level 2 from Level 3: A Level 2 candidate extracts the first 8 characters of a string because that is where the relevant data always appears in the sample data. A Level 3 candidate writes =LEFT(A2, SEARCH("-", A2)-1) because they know the sample data structure may not hold for all 10,000 rows — and they build the formula to adapt to the actual delimiter rather than the assumed position. Dynamic composition that references structure rather than position is the characteristic that makes string formulas robust at scale.
The Automation Mindset: Four Techniques That Signal Systems Thinking
The following four techniques are not tested because they require rare or advanced Excel knowledge. They are tested because the decision to reach for them — rather than a manual approach — reveals whether a candidate has developed the automation instinct that ByteDance's high-output environment demands. Each one is a proxy question: not 'do you know this feature?' but 'do you think at the system level?'
The Distinct Count via Data Model question is the one that most candidates get wrong not because they lack statistical understanding — they know what a distinct count is — but because they are unaware that standard Pivot Tables count all instances including duplicates. The Data Model checkbox is a UI detail, but knowing it exists signals platform depth. Interviewers use this question as a fast filter: candidates who know it have spent real time building production-grade Pivot Table reports. Candidates who don't know it have used Pivot Tables for basic summaries.
The Full Series: D1, D2, D3 in Comparison
The three-day ByteDance DA interview series builds a cumulative profile of one hire standard: the ability to move from raw data to defensible decision. Day 1 establishes that you can extract the right data. Day 2 establishes that you can validate whether what the data says is true. Day 3 establishes that you can present it in a form that a busy stakeholder can act on — and that you built the workflow to do it again tomorrow without starting from scratch.
The principle that runs through all three days of the ByteDance DA series: Efficiency is not about typing faster. It is about making the tool do the work for you — and building systems that make the question permanently easier to answer the next time it arrives. SQL is how you extract data. Statistics is how you prevent that data from lying to you. Excel is how you turn the validated result into a decision that gets acted on. A candidate who can do all three, at ByteDance's scale and pace, is the candidate the offer goes to.