|
Workopia IntelligenceThe Narrow Boom · Australia · June 2026
| ||||||||||||||||||||||||||||||||||||||||||||||||||||||||||||||||||||||||||||||||||||||||||||||||||||||||||||||||||||||||||||||||||||
|
workopia.io/hiAustralia · June 2026 Labour Market Snapshot · Preliminary00 / 00
| ||||||||||||||||||||||||||||||||||||||||||||||||||||||||||||||||||||||||||||||||||||||||||||||||||||||||||||||||||||||||||||||||||||
 Australia · June 2026 Australia · June 2026Workopia Intelligence
The narrow boom: what Australia’s +23% is actually made ofAdvertised demand rose 23% in June — but the number is louder than the economy beneath it. Almost all of the gain traces to two dated, policy-driven builds — a regulated copper-to-fibre broadband rollout and the staffing mandates of the new Aged Care Act — concentrated in Sydney and Melbourne, on-site and full-time. Read against the cycle, this is pressure the Reserve Bank is trying to cool, not a turn it would welcome. And the most durable signal sits underneath the volume: on both sides of the job ad, demand is tilting toward human skills, not digital ones. 162,342 Live postings, end of June +23% Month-on-month (+30,376) 2 Policy-driven forces behind the gain In briefThe headline is real but already spent. Postings rose from 131,966 to 162,342 (+23%, +30,376), but the weekly path — +5%, +4%, +5%, +1% — shows the lift landed in the first fortnight and July opened flat. This is a one-off level-shift, not a compounding trend; we would not annualise it. Read against the cycle, it is pressure, not a green light. The rebound is directionally aligned with the ABS (May employment +40.3k, unemployment down), but the standing market is loosening — vacancies up only ~3.7% y/y, the vacancy-to-unemployment ratio eased to 0.51 — and the RBA is back to raising rates (4.35%). A burst of advertised hiring here is what the Bank is trying to cool. The engine is narrow, and external. Two forces do roughly half the work: a telecom network build (visible in occupations — field technicians the #1 net-new role, network engineers +286%) and healthcare (the #1 net-new industry, +2.3k roles). Both are dated: a 1 July fibre-eligibility milestone, and the Aged Care Act’s staffing mandates. One engine recedes, one persists. Telecom field work is cyclical and ends when the build matures; healthcare, driven by ageing and legislation, does not switch off. The cleanest forward test is whether telecom fades while healthcare holds. The sharpest signal is a two-sided human-skills tilt. The fastest-rising requirements were leadership, stakeholder management and hands-on collaboration; and employers pitched themselves the same way — collaborative culture, flexibility, mentorship. That is the opposite of the digital-skills diffusion reported across the region. One national number, two economies. Sydney and Melbourne are ~two-thirds of postings and ~80% of net-new — but Melbourne is hiring nurses, doctors and midwives while Sydney hires analysts, data scientists and field crews. Pay didn’t move; the mix did. The median advertised salary is ~$105,104 (about +2% on the month) — composition, not pay pressure — against a strikingly wide distribution: a thin, expensive specialist tier far above the median and the volume-driving field roles (~$77k) below it. 01 · The month in one frame
A level-shift, read against a late cycle — and Australia was not aloneJune was a firm month for advertised demand, and it is worth saying so plainly before qualifying it: live postings rose from 131,966 at the start of the month to 162,342 by its close — a 23% increase, roughly 30,400 additional roles. On the surface that is a strong print. The shape of the month is what tells you how to read it. The weekly path — +5%, +4%, +5%, then +1% — shows the lift arriving almost entirely in the first fortnight and flattening into month-end, with July opening on the same plateau. That is the signature of a one-off level-shift: a discrete step up in the stock of open roles, not a market compounding week after week. We would not annualise it, and neither should anyone building a plan off it. Most of June's growth came in the first half; the market settled near 162,342 by month-end A1.3 · Total AU live postings — daily shape Interface · 06-01→06-30 · (candidate for appendix) now 162,342 Placed in a global frame, June’s firming is not distinctly Australian. Across the markets we track, only the United States contracted (−7%); Australia’s +23% sat alongside Singapore (+30%), Canada (+26%) and the United Kingdom (+19%). Some meaningful part of the Australian move is therefore a broad, non-US component rather than anything domestic — a discount to apply before reading the headline as a signal about Australia specifically. What keeps the number credible rather than a data quirk is that the official series was already turning the same way. ABS Employment Change dipped in April (−18.6k) and rebounded strongly in May (+40.3k, released 25 June), with unemployment falling against expectations. Our postings lift is directionally aligned with an officially confirmed pickup — though we are careful not to equate the two, since advertised-demand flow and net employment are different quantities, measured differently. Here is where an economist’s read diverges from the cheerful one. The standing market beneath the rebound is still loosening, not tightening: ABS Job Vacancies are up only ~3.7% year on year, the vacancy-to-unemployment ratio has eased to 0.51, and the RBA has reversed course to raising rates (4.35%) after an energy shock met an already-tight labour market. In that regime, a burst of advertised hiring is not a green light — it is closer to the pressure the Bank is actively trying to cool. A seasonal wrinkle cuts the same way: 30 June is Australia’s end of financial year, which makes June structurally busy, and with under a year of history we cannot seasonally adjust, so a raw month-on-month figure over-reads a month that is strong by the calendar. Our working conclusion is deliberately unglamorous — a real step up in level, landed early, flattered by seasonality and read against a market that is still cooling underneath. 02 · What actually drove it
Two engines — one dated and cyclical, one dated and structuralThe most important fact about June is not the 23% — it is how little of the economy produced it. Decompose the net-new and the demand collapses onto two forces; the rest is spread thinly across hospitality, retail, finance and the long tail. Driver one — the copper-to-fibre network build. cyclical · recedes Reading this engine correctly requires a small act of discipline. The telecommunications industry line was recalibrated this month after a source-quality clean-up — one reason the headline settled at +23% from a provisional +24% — so we do not read the build through the industry tag. We read it through occupations and skills, where it is unmistakable. Field service technicians were the single largest contributor to net-new roles; network engineers grew +286% off a small base; and the requirements riding underneath — copper-and-fibre, 5G-core, “current driver’s licence” — together with the employers doing the hiring, point to one thing: the labour footprint of a network build. Network Engineer: 1% of market, +286% growth — big & rising A1.5 · Occupation — size vs growth (top 30 + key roles) Share of market (x) vs June growth (y), bubble = volume · every bubble numbered — see footnote · incl. SWE/AI/Data/PM Numbered (smaller) roles: 1 RN (Registered Nurse) (+30%, 2.1%) 2 Store Manager (+27%, 1.7%) 3 Project Manager (+13%, 1.6%) 4 Sales Manager (+4%, 1.6%) 5 Business Development Manager (+9%, 1.2%) 6 Account Manager (+36%, 1.2%) 7 Mechanical Engineer (+6%, 1.2%) 8 Sales Consultant (+32%, 1.1%) 9 Chef (+33%, 1.1%) 10 Marketing Manager (+23%, 1.0%) 11 Personal Banker (+7%, 1.0%) 12 Risk Manager (+16%, 1.0%) 13 Relationship Manager (+17%, 0.9%) 14 Production Worker (+6%, 0.9%) 15 Program Manager (+16%, 0.9%) 16 Safety Manager (+14%, 0.9%) 17 Executive Assistant (+43%, 0.9%) This is not abstract. It is the national copper-to-fibre migration hitting a mandated inflection: from 1 July 2026, roughly 600,000 additional premises on legacy copper connections become eligible for full-fibre upgrades as a speed-tier requirement is removed — on top of an upgrade program already running near 47,000 connections a month, and ahead of a regulated switch-off that will make copper retirement compulsory. Every one of those upgrades needs a two-to-four-hour on-site install. That is the mechanism by which a broadband policy becomes a field-technician hiring wave — and it explains why the demand skews to workers with a licence, a vehicle and hands-on experience, and why it sits low on the pay scale (field-technician median ~$77k against a ~$105k market). It is also, by construction, cyclical: build programs end, and when deployment matures this demand recedes. Signal in the data Field-and-network roles led net-new; copper-fibre and 5G-core skills rising; the roles concentrate among network-build and infrastructure employers. →
Verifiable driver The regulated copper→fibre migration — a mandated 1 July eligibility milestone; each upgrade needs a 2–4 hr on-site install. Driver two — Aged Care Act 2024 compliance. structural · persists Healthcare is the quieter, more durable engine — the clear leader by industry net-new (+2,300 postings), led by registered nurses and case managers at hospitals and aged-care providers. The skills attached — AHPRA registration, aged-care experience, compassionate care, and an unusually visible line for the AN-ACC funding framework — point to a specific, dated driver: the Aged Care Act 2024, in force since November 2025, which mandates a registered nurse on site 24/7 and 215 care-minutes per resident per day, with funding tied to delivered care-minutes from April 2026. Unlike the telecom build, this is not a project with an end date. It is demand manufactured by demography and legislation together, and it does not switch off. Healthcare leads at 2.3k A2.3 · Industry / sector — where June's NET-NEW came from Top contributors to net-new postings (Jun 1→now) · value + share of the ten largest industry gains Healthcare 2.3k 29% Retail 1.3k 16% Hospitality 1.0k 13% Financial Services 618 8% Technology 537 7% Mining 532 7% Insurance 524 7% Information Technology 389 5% Transportation & Logistics 372 5% Education 331 4% Two very different engines prop up one headline: a telecom build that will end, and a healthcare demand curve that will not. The cleanest forward test is whether telecom fades while healthcare holds.
03 · The sharpest signal
Demand is tilting human, not digitalIf the drivers are the story most readers expect, the most interesting signal is one they may not. The regional narrative — argued well by Indeed’s Hiring Lab — is that digital skills are diffusing into nearly every occupation across Asia-Pacific. Australia’s June points somewhere more human. The fastest-rising requirements this month were not tools or platforms but people skills — team leadership (the single largest net gainer among required skills), stakeholder management, client-relationship and hands-on collaboration. The one apparent exception, a rising “driver’s licence” requirement, is not a skill trend at all: it is a credential tracking the field-technician build, and we exclude it from the skills exhibit. Team leadership rose most (+525); Saturday availability required fell most (+6) A1.11 · Required skill — rising & fading Net change in postings requiring each skill, Jun 1→now Team leadership +525 Microsoft Office proficiency +369 Project management +230 Client relationship management +225 Safety compliance +223 Regulatory compliance +217 Inventory management +208 Consultative selling +30 Eye for detail and accuracy +23 Lift up to 16kgs regularly +20 Saturday availability required +6 The tell is that the same tilt shows up on the other side of the job ad. When employers advertised themselves — the nice-to-have culture lines they choose to lead with — they leaned the same way: a collaborative team environment (by far the most-cited, and rising fast), flexible working, mentorship, a proactive and customer-centric mindset. Both what employers require and how they sell themselves are moving toward how people work together, not toward the technologies they work with. Collaborative team environment leads at 2.4k A1.12 · Preferred (nice-to-have) skills As listed by employers in the JD · postings + %Δ Collaborative team environment 2.4k +122% Proactive attitude 505 +158% Mentoring junior team members 333 +49% Flexible working arrangements 314 +134% Good communication skills 289 +80% Strategic thinking 263 +807% Process improvement 260 +145% Proactive problem-solving 245 +115% Customer-centric mindset 237 +117% Customer service orientation 205 +173% Community engagement 201 +379% Customer focus 179 +156% We read this as a market competing on retention and culture rather than on capability scarcity — consistent with a late-cycle economy where firms are protecting the teams they have rather than racing for scarce new skills. It is a small signal in a noisy month, but it is a consistent one across both sides of the ad, and it runs against the regional grain. If it holds, it says more about the state of Australian hiring than the +23% does. 04 · One number, two economies
Not a two-city market — two different economies sharing one lineSydney and Melbourne together are about two-thirds of live postings and roughly 80% of net-new, which is unremarkable — it is where the population, the head offices and the densest upgrade footprint sit. The revealing fact is not the concentration but the divergence. Rank each city’s fastest-growing roles and they describe two different economies sharing one national line: Melbourne’s climb is care-and-clinical — registered nurses, health-setting operations managers, physical therapists; Sydney’s is corporate, technical and build — account and sales managers, business analysts, field crews. RN (Registered Nurse) moved most 06-01→06-27: 34→77 Melbourne × occupation — 5 dates Live postings · 06-01, 06-08, 06-15, 06-22, 06-27
Account Manager moved most 06-01→06-27: 33→78 Sydney × occupation — 5 dates Live postings · 06-01, 06-08, 06-15, 06-22, 06-27
“Australia +23%” is an average over two labour markets that are, functionally, hiring for different kinds of work. The market is also fragmented across employers — the top three hold about 4% of postings — so this is a story about places and roles, not any single firm. For anyone reading the national figure as one signal, that is the caution: it isn’t one. 05 · The standing shape of demand
Beneath the month’s change, what the market simply isStepping back from what moved to what simply is: a few markers of the market’s composition at month-end — each read on its own terms, and each with the caveats a careful reader deserves. The work is on-site and full-time — with an honest asterisk. Among classified postings, on-site dominates (roughly 19k against 3.5k hybrid and 1.7k remote), and full-time is the large majority of net-new. But two things keep us from over-reading it. First, work-mode is classified on only a minority of postings (~24k of 162k), so the split is a read on a slice, not the whole. Second, the month showed abrupt compositional swings — the on-site share jumped double digits and the full-time share fell double digits week-on-week — that are too large to be real economy and are better explained by classification and coverage changes than by employer behaviour. The safe statement is directional: new demand this month favoured people who can be physically present and work full-time, with essentially no remote growth. We would not put a decimal place on it. The pay distribution is unusually wide — and it is really two distributions. The median advertised salary is about $105,104 and barely moved over the month (~+2%) — composition, not pay pressure. Around that median sit two different pay economies: a thin, expensive tier of engineering managers, product managers and senior software and specialist roles far above it, and the volume-driving telecom build roles below it. The median is stable precisely because these two move against each other. For an operator, the practical read is blunt: the abundance is at the bottom of the wage scale and the scarcity is at the top, and nothing in this month’s volume relieves the competition for the expensive tier. Engineering Manager leads at $179,829 A1.16 · Highest-paying occupations Median disclosed A$ (now) · roles also shown in A1.5 Engineering Manager $179,829 Product Manager $166,810 Software Engineer $156,850 Physician $153,335 Senior Software Engineer $152,388 Diesel Mechanic $140,000 Program Manager $136,064 Nurse Educator $128,894 Instructor $127,436 Business Analyst $125,102 other $118,700 Operations Manager $115,357 06 · What we would watch
Three reads to carry past the headlineFor the cycle. Treat +23% as level, not momentum, and as pressure the RBA is leaning against, not evidence the labour market has turned. The single cleanest test is compositional — does telecom recede while healthcare holds into July? If it does, the standing market is as soft as the vacancy-to-unemployment ratio (0.51) implies, and the burst was a seasonal-plus-policy artefact. We would revisit hard when the ABS next prints. For operators hiring into this market. The volume is loud but narrow and low on the pay scale, and it will not help where hiring is hardest. If you are competing for the expensive specialist tier, this month offers no relief — and the human-skills tilt is your signal to compete on team, flexibility and development, not on title inflation. If you are staffing field or clinical roles, the binding constraint is credentials and presence — licences, AHPRA registration, on-site availability — not exotic skills, and speed of process will beat pay. For anyone building on this data. Separate the signal you can trust from the number you cannot. Direction, ranking, shares and the front-loaded shape are robust; individual percentage moves off near-zero bases, the recalibrated telecom line, and the work-mode split on partial coverage are not. The discipline that makes 162,342 usable is reading categories and top-three groupings, not single lines. The bottom line
A real step up, but a narrow oneStrip June back and it is a policy-driven copper-to-fibre network build plus the staffing mandates of the Aged Care Act — concentrated in two cities, on-site and full-time, with a quiet, consistent tilt toward human skills on both sides of the job ad. The durable half is healthcare; the cyclical half is telecom, and it will ease as the build matures. With momentum decelerating and July opening flat, the month ahead is more likely to consolidate this level than to repeat June’s jump — and against a still-loosening market and a central bank leaning the other way, that is the more useful thing to know than the 23% itself. ◆ Methodology & how to read these numbers
Why we read categories, not single lines
Explore Australia — live on Workopia
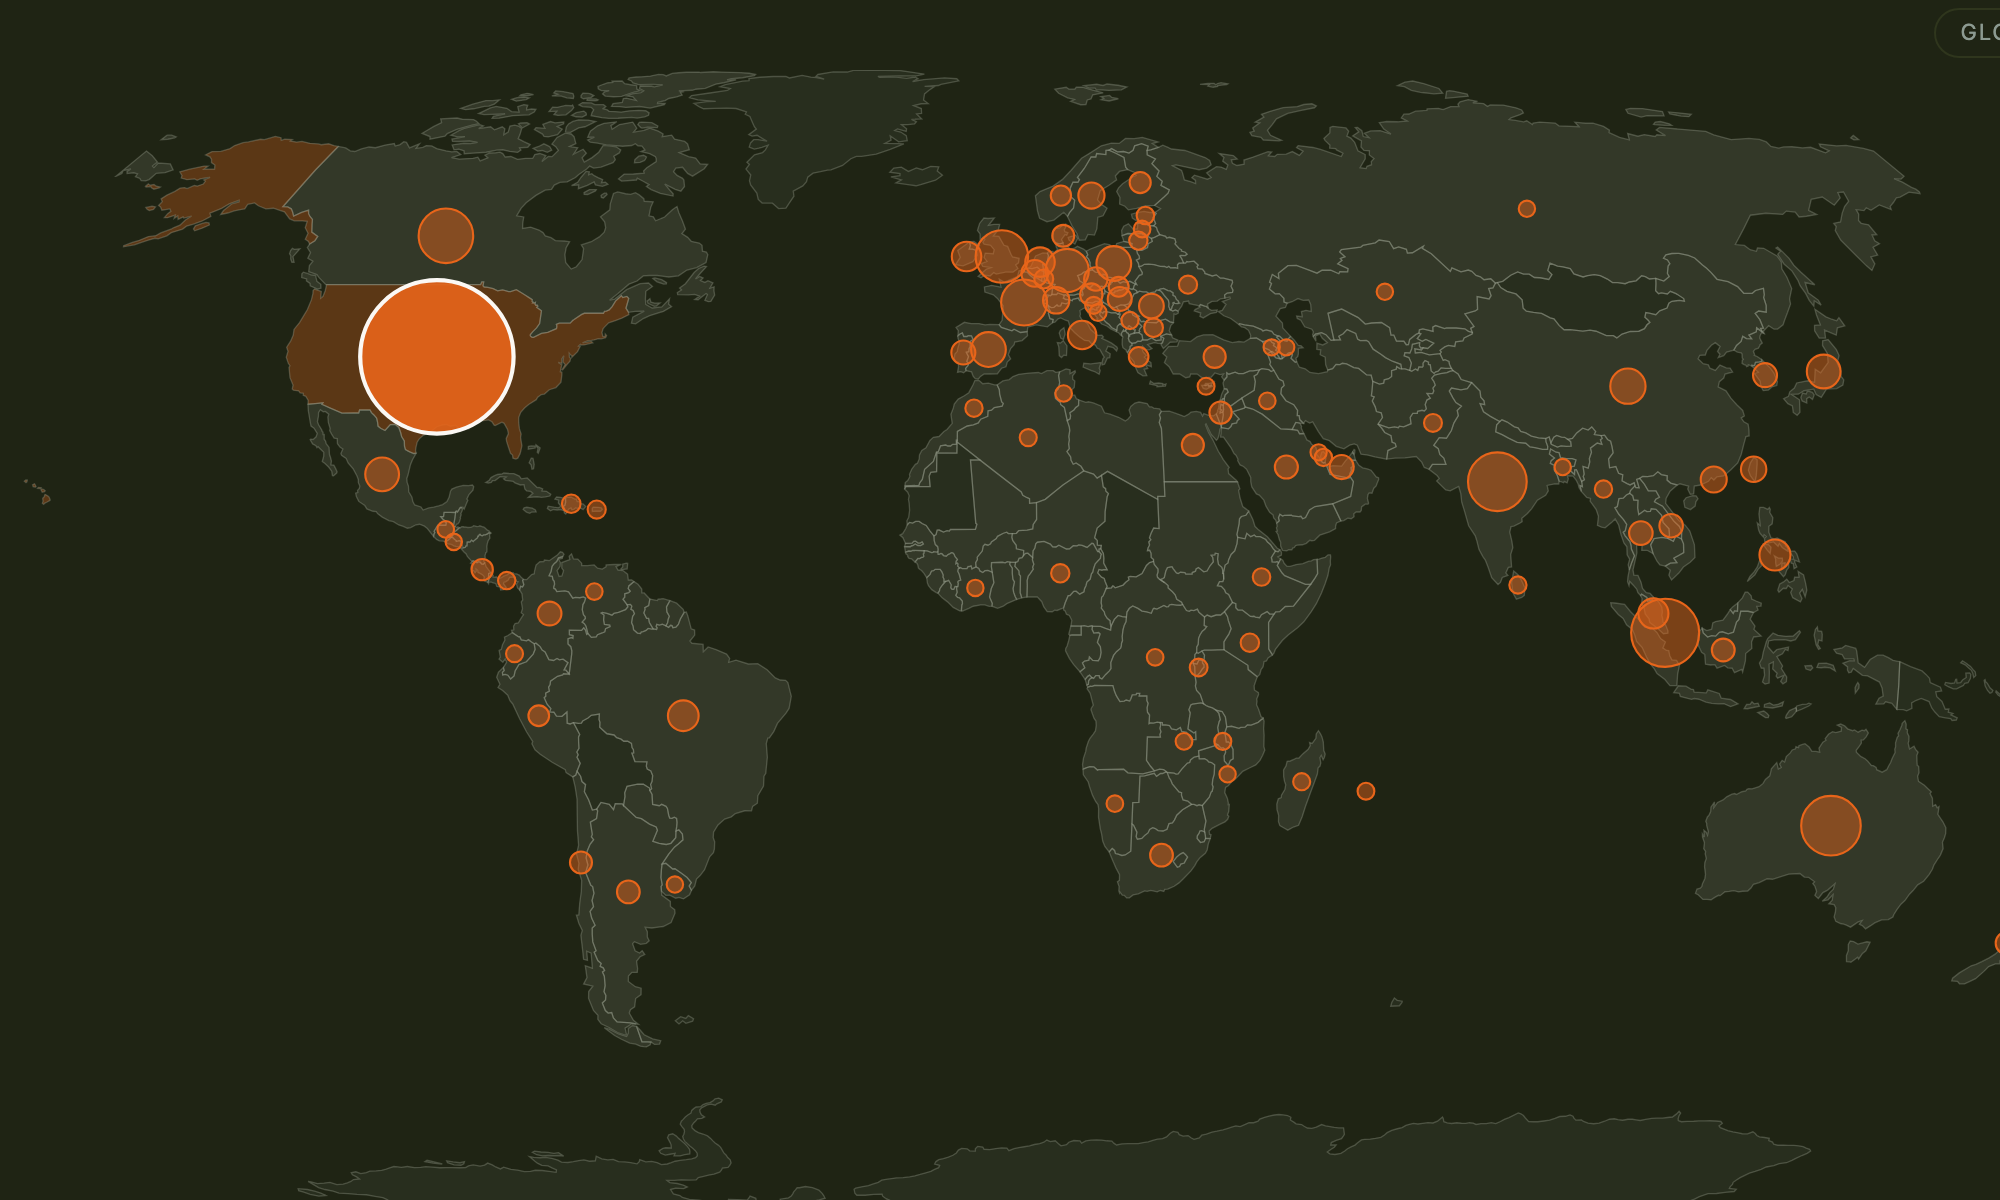 Global Hiring Monitor — Australia→
The live hiring globe, landing on Australia — open roles and daily net change, updated daily.
Global Hiring Monitor — Australia→
The live hiring globe, landing on Australia — open roles and daily net change, updated daily.
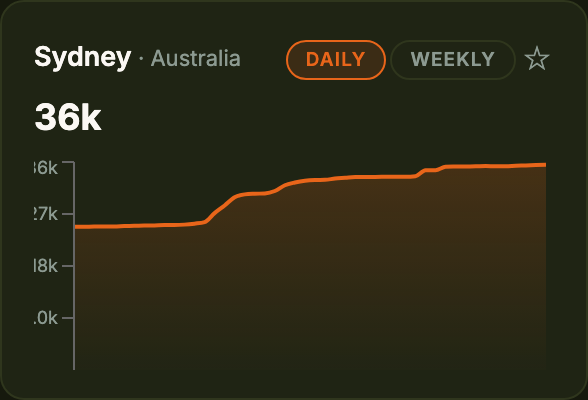 Hiring Trends — Australia→
Daily open-roles growth for Sydney, Melbourne and every tracked Australian city.
Hiring Trends — Australia→
Daily open-roles growth for Sydney, Melbourne and every tracked Australian city.
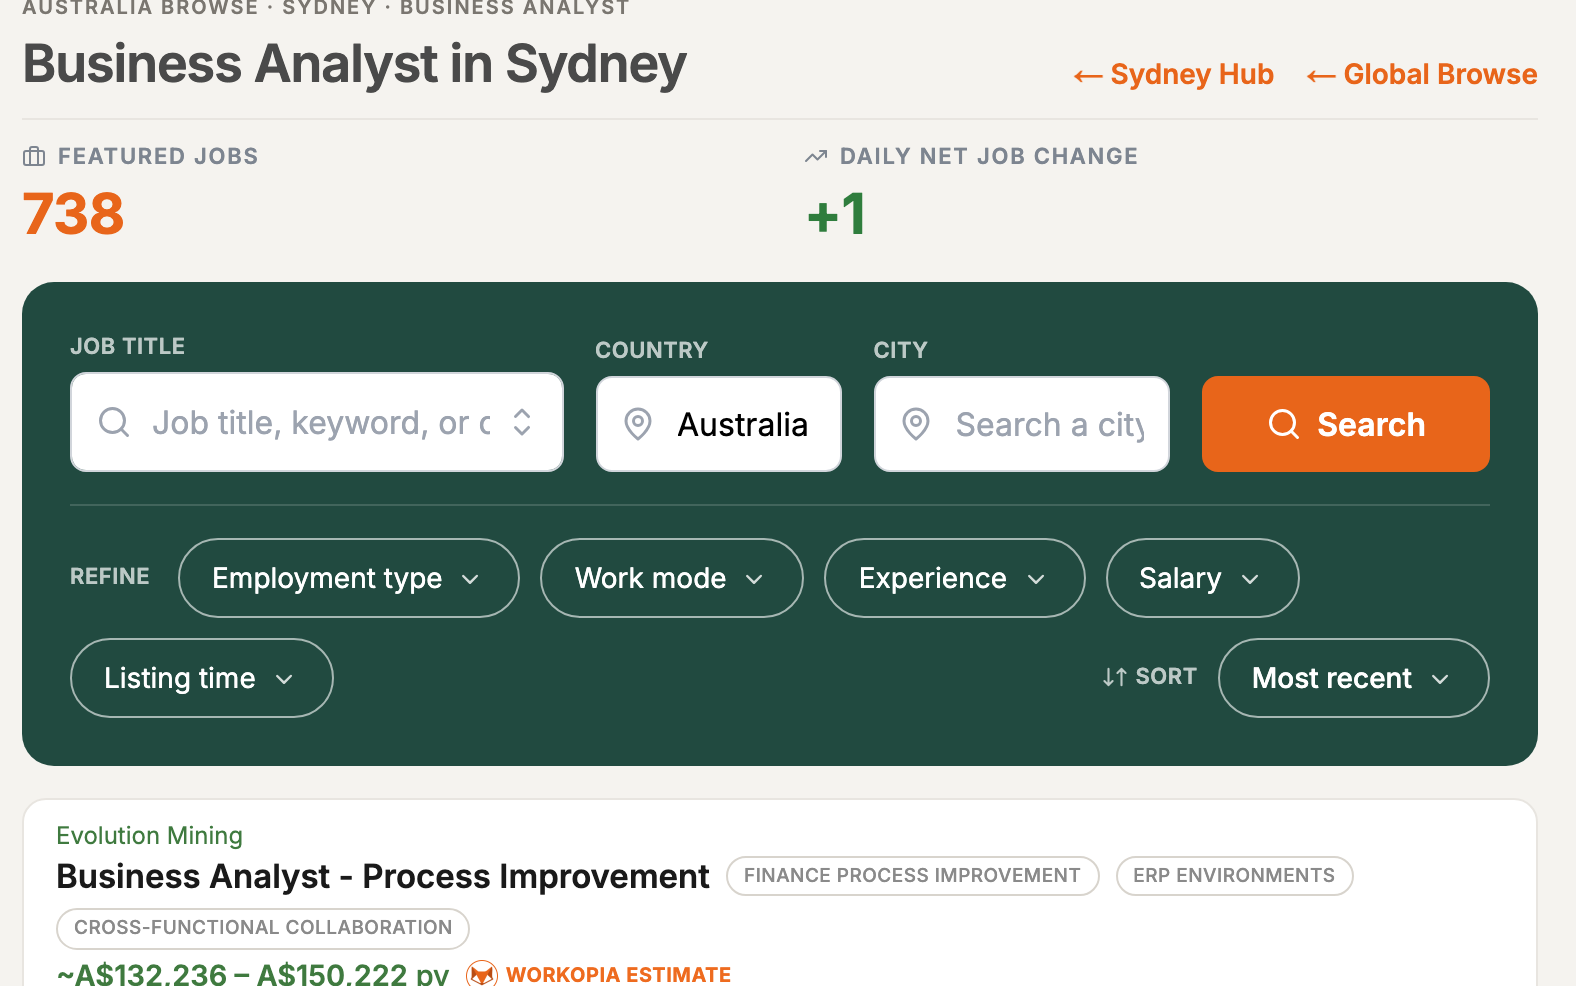 Browse jobs in Australia→
162,000+ live Australian job ads — browse Sydney, Melbourne and more by role and category.
Browse jobs in Australia→
162,000+ live Australian job ads — browse Sydney, Melbourne and more by role and category.
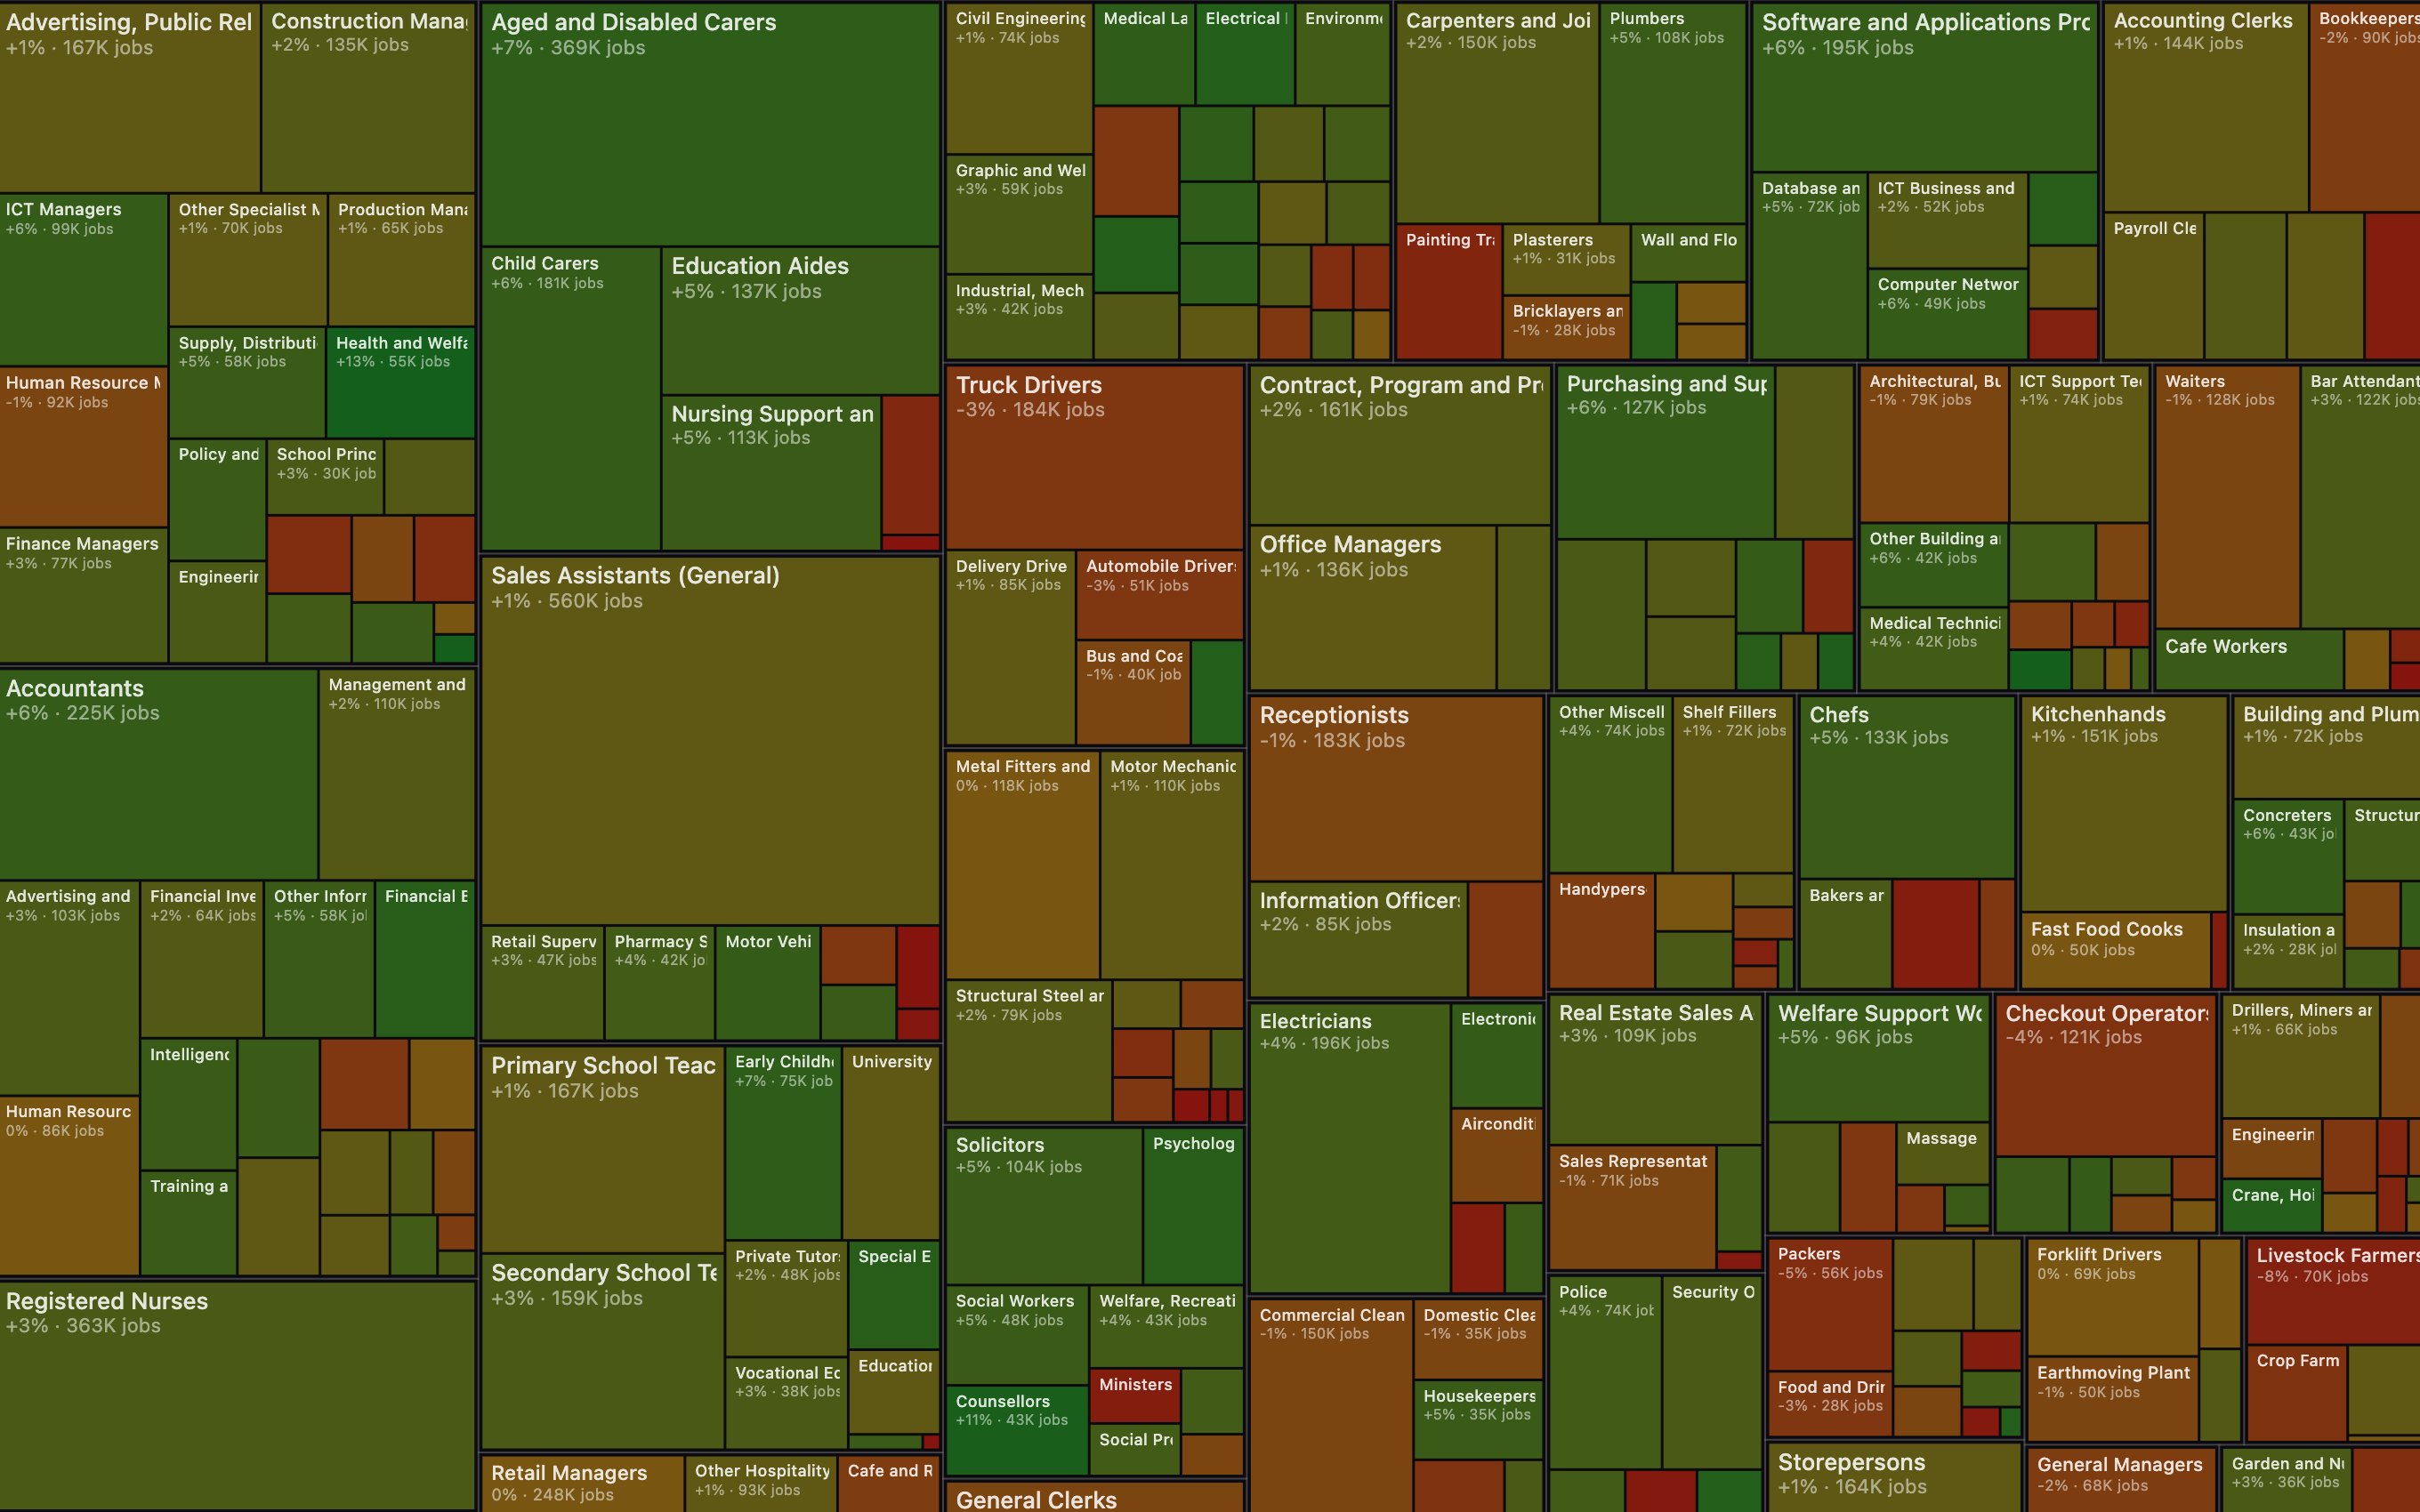 Where the jobs are going→
Occupation outlook — growth and AI-exposure projections for the decade ahead.
Where the jobs are going→
Occupation outlook — growth and AI-exposure projections for the decade ahead.
Australia labour market — FAQ
Is hiring picking up in Australia in June 2026? Advertised job postings rose about 23% over June to roughly 162,000, but the gain was narrow and front-loaded: two forces — a regulated copper-to-fibre network build and structural aged-care demand — drove most of it, concentrated in Sydney and Melbourne. It reads as a one-off level shift rather than a compounding trend, and momentum had flattened by month-end. What is driving Australian hiring growth right now? Two dated policy drivers. First, the regulated copper-to-fibre migration — a mandated 1 July upgrade milestone — pulled forward demand for field technicians and network engineers. Second, the Aged Care Act 2024, which mandates 24/7 registered nurses and care-minutes, is a structural driver of nurse and aged-care hiring. The telecom build is cyclical and will recede; healthcare demand persists. Which cities are hiring most in Australia? Sydney and Melbourne make up about 68% of live postings and roughly 80% of net-new in June 2026 — but they are hiring for different economies. Melbourne's fastest-growing roles are nurses, doctors, midwives and case managers; Sydney's are analysts, data scientists, product designers and field service technicians. Are digital skills or soft skills rising faster in Australia? In June 2026 the most interesting signal was people skills, on both sides of the job ad. The fastest-rising requirements were leadership, stakeholder management and hands-on collaboration; and when employers advertised themselves, they leaned to a collaborative team environment, flexibility and mentorship — a human-skills tilt rather than the broad digital-skills spread seen elsewhere in Asia-Pacific. How real-time is this Australian hiring data? It is drawn from live online job postings on Workopia, measured across the full month of June (1–30) and refreshed daily — 162,342 live ads as of 2 July 2026. It is an advertised-demand indicator, not seasonally adjusted, cross-checked against ABS Employment Change, Job Vacancies and RBA policy, and updated when the ABS prints. We build the infrastructure layer for AI to understand, reason, and execute work Workopia Intelligence is the labour-market research practice of Workopia. We turn the world’s live job postings into a continuously refreshed reading of hiring demand — across 73,000+ companies, 94 countries and 2,500+ cities — so leaders, investors and policymakers can see where the labour market is moving in real time, not months after the fact. Our monthly country briefs read categories and top-line groupings rather than single data points, cross-check every move against official statistics, and separate durable signal from coverage noise — a leading, decision-grade read on where hiring is heading. Contact
For briefings, media, or permission to cite this report: nic@workopia.io Data Partnership
License the underlying postings data, commission a custom country or sector cut, or co-publish with our team. © 2026 Workopia Intelligence · A leading read on global hiring demand. |